Interpreting effect size F squared and Q squared
Posted: Sun Feb 10, 2019 12:19 pm
Hi all,
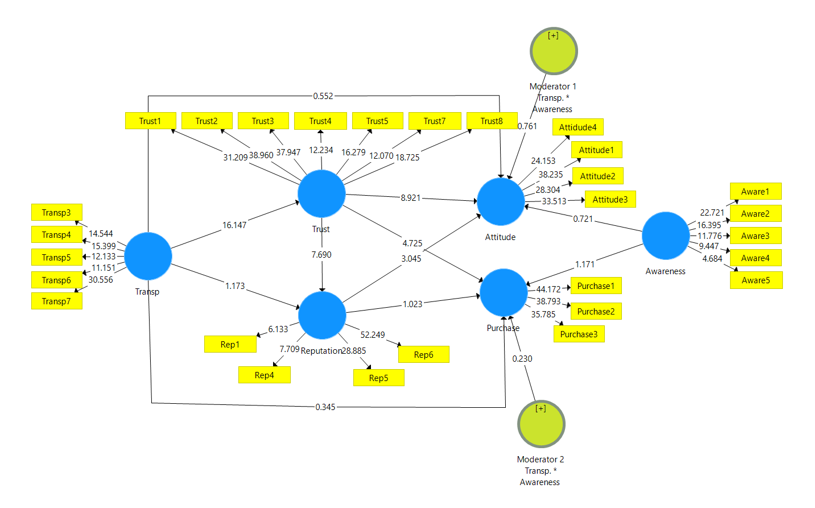
I have a model with:
1 IV
2 Mediators (serial mediation)
2 DVs
1 Moderator (between direct link IV --> DV1 and IV --> DV2)
First question about effect size: I calculated the f2 value with SmartPLS and I have found six relationships with no effect, namely: Moderator link 1, moderator link 2, mediator 1--> DV1, IV --> DV1, IV --> DV2, and IV --> Mediator 1
My question now is, what does this mean? I follow the logic of Cohen saying that 0.02, 0.15, and 0.35, respectively represent small, medium, and large effects of the exogenous variable. But how do I write about this in my thesis and does it have consequences? Important to note: the relationships that have no effect are also non-significant.
Second question about Q2.
I have determined that my Q2 values are above 0, so the predictive relevance is guaranteed. Is it necessary or recomended to also calculate q2?
Thank you very much in advance!
I attached a picture of my model.