Page 1 of 1
INTERPERATATION OF T-VALUE
Posted: Tue Feb 09, 2016 4:27 pm
by Farahnaz
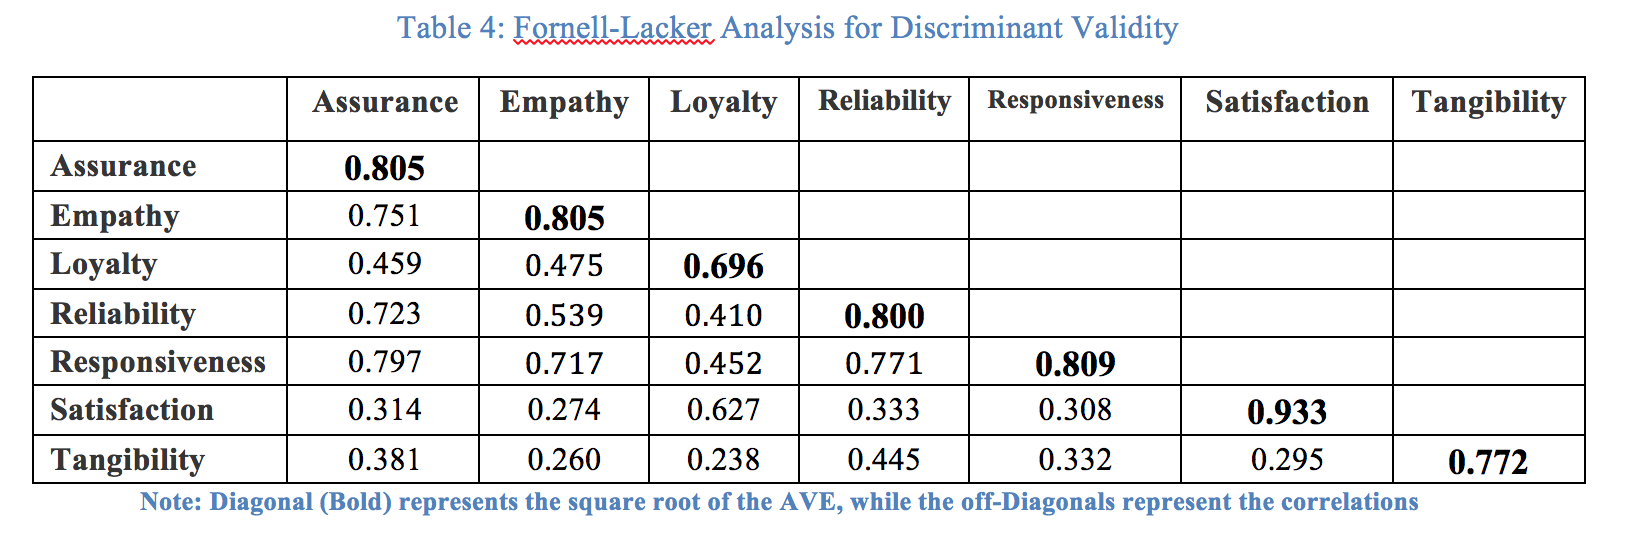
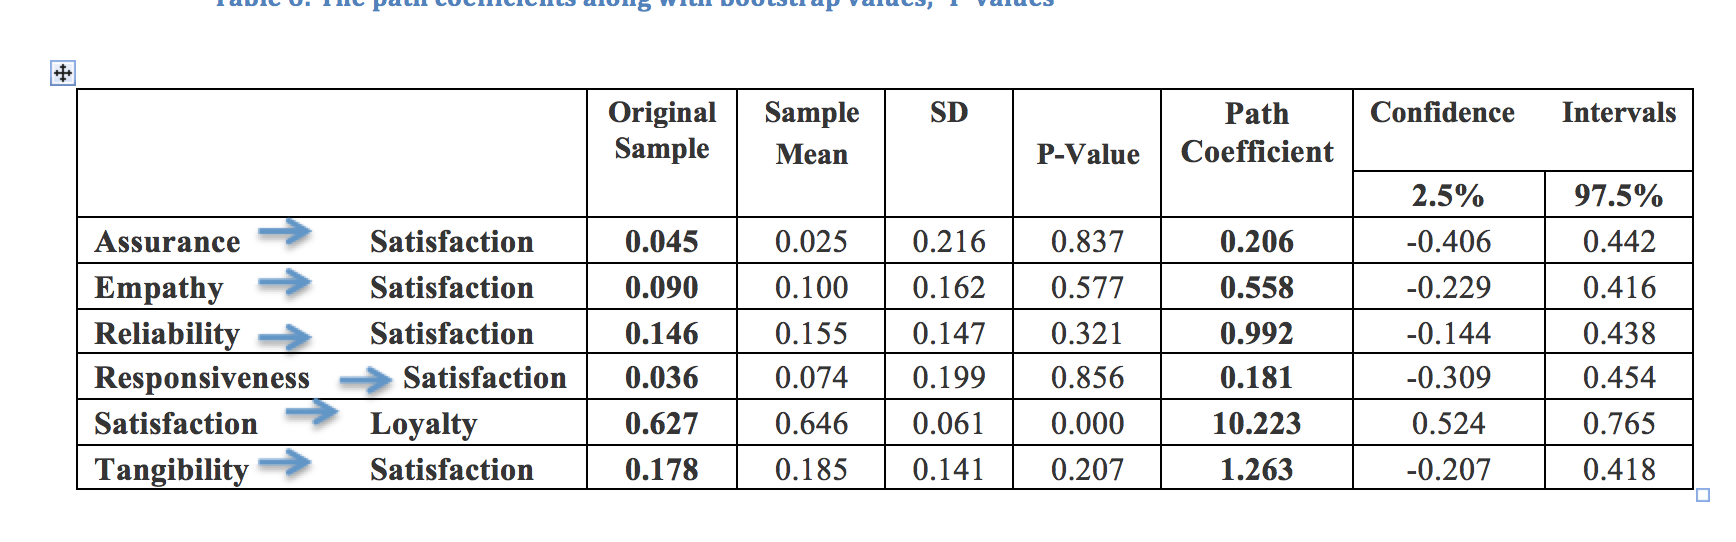
I am new in smart pls , I run an analysis for my master thesis , the model is valid and reliable but all my t-value arenot significant, less than 1.96, the highest is 1,21 between independent variable and satisfaction(as a dependent variable ) but it is signifficant between satisfaction amd loyalty (2 dependent ) variable , how can I interperate this ? because all my hypothesis would be rejected?
my model is as follow ,if there any possibility that my model is not correct?
please answer me as i have to submit my thesis in 10 days.
Re: INTERPERATATION OF T-VALUE
Posted: Tue Feb 09, 2016 5:29 pm
by jmbecker
Without having more information it is hard to say. There could be many problems. For example,
- low sample size and hence, low power to detect small and medium effect sizes.
- collinearity between your independent constructs.
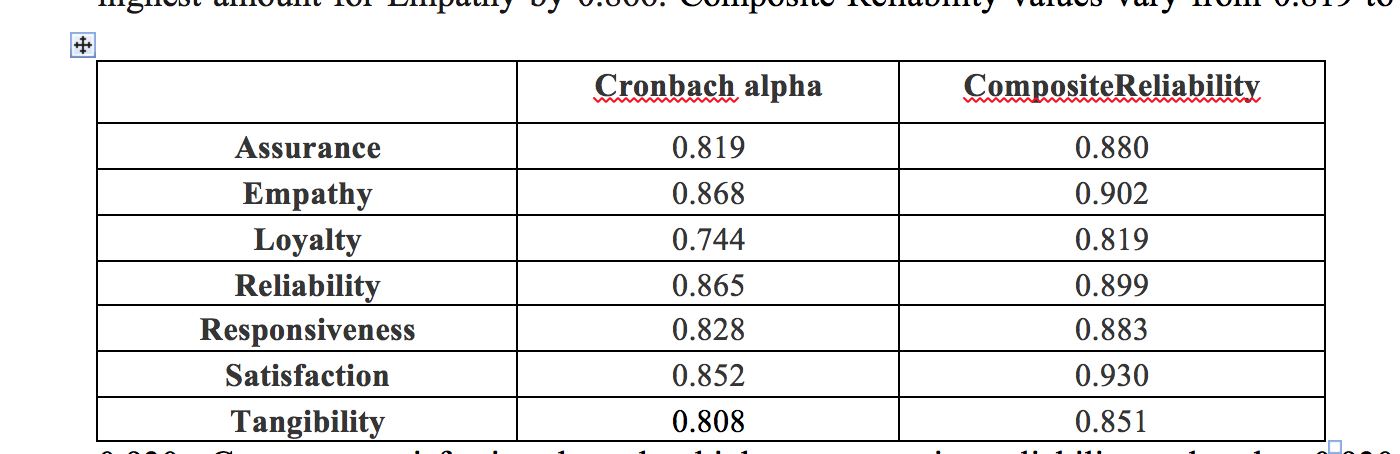
- low reliability of your construct scales and hence, strongly attenuated correlations.
- simply not (or very small) effects.
... and many more...
Re: INTERPERATATION OF T-VALUE
Posted: Tue Feb 09, 2016 6:29 pm
by Farahnaz
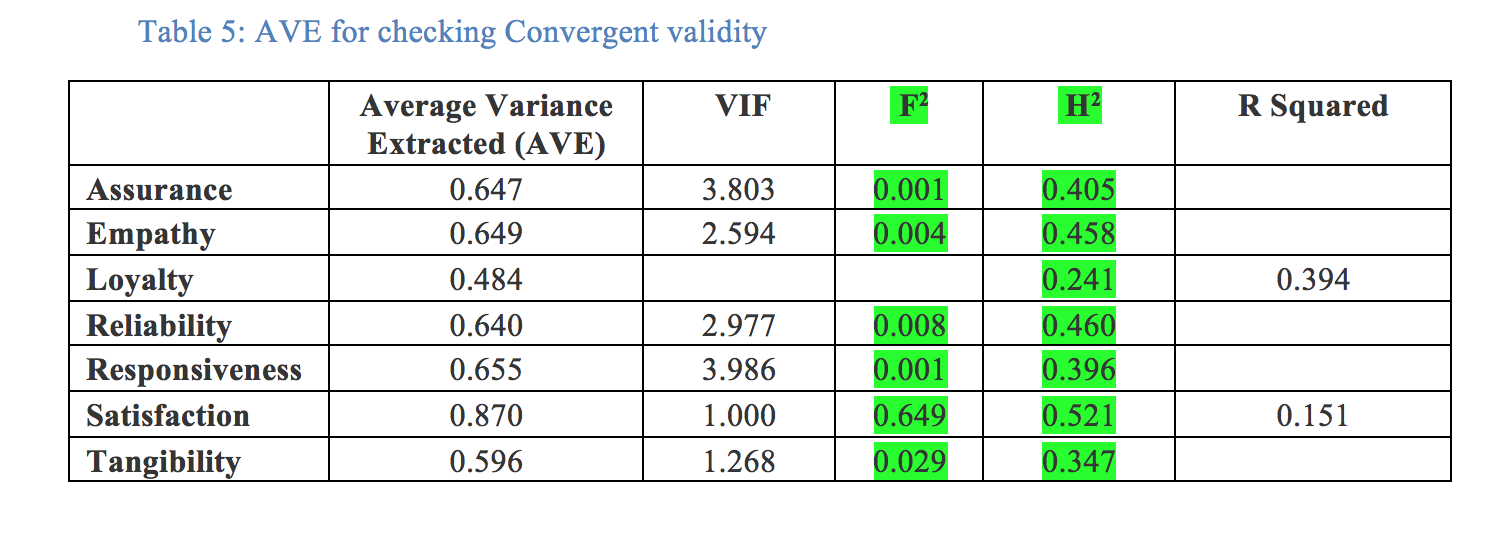
thanks for your prompt answer, actually my sample size is small about 100 , but i don’t have any problem in other part , all VIF are under 5 , R2 is not too high but acceptable , i will send you in attachment all the table ,please take a look on it
thanks in advance
Re: INTERPERATATION OF T-VALUE
Posted: Tue Feb 09, 2016 6:37 pm
by Farahnaz
- Screenshot 2016-02-09 19.36.41.png (150.32 KiB) Viewed 13554 times
- Screenshot 2016-02-09 19.34.53.png (93.94 KiB) Viewed 13554 times
Re: INTERPERATATION OF T-VALUE
Posted: Tue Feb 09, 2016 6:40 pm
by Farahnaz
- Screenshot 2016-02-09 19.37.59.png (182.25 KiB) Viewed 13554 times
- Screenshot 2016-02-09 19.37.47.png (136.72 KiB) Viewed 13554 times
Re: INTERPERATATION OF T-VALUE
Posted: Tue Feb 09, 2016 6:42 pm
by Farahnaz
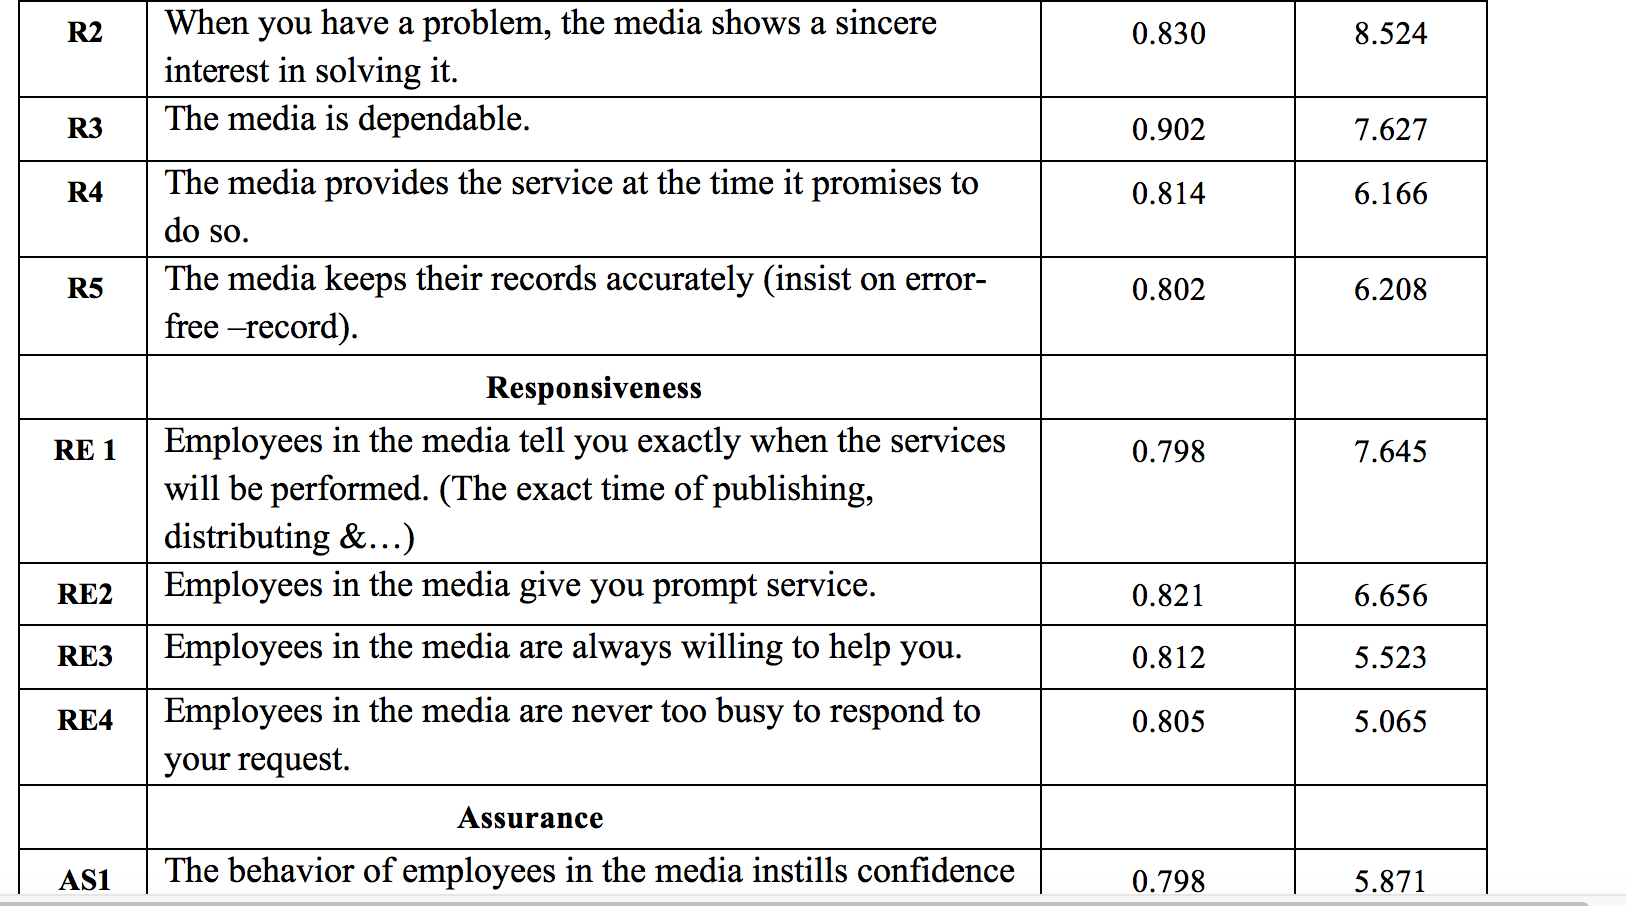
- Screenshot 2016-02-09 19.41.15.png (200.24 KiB) Viewed 13554 times
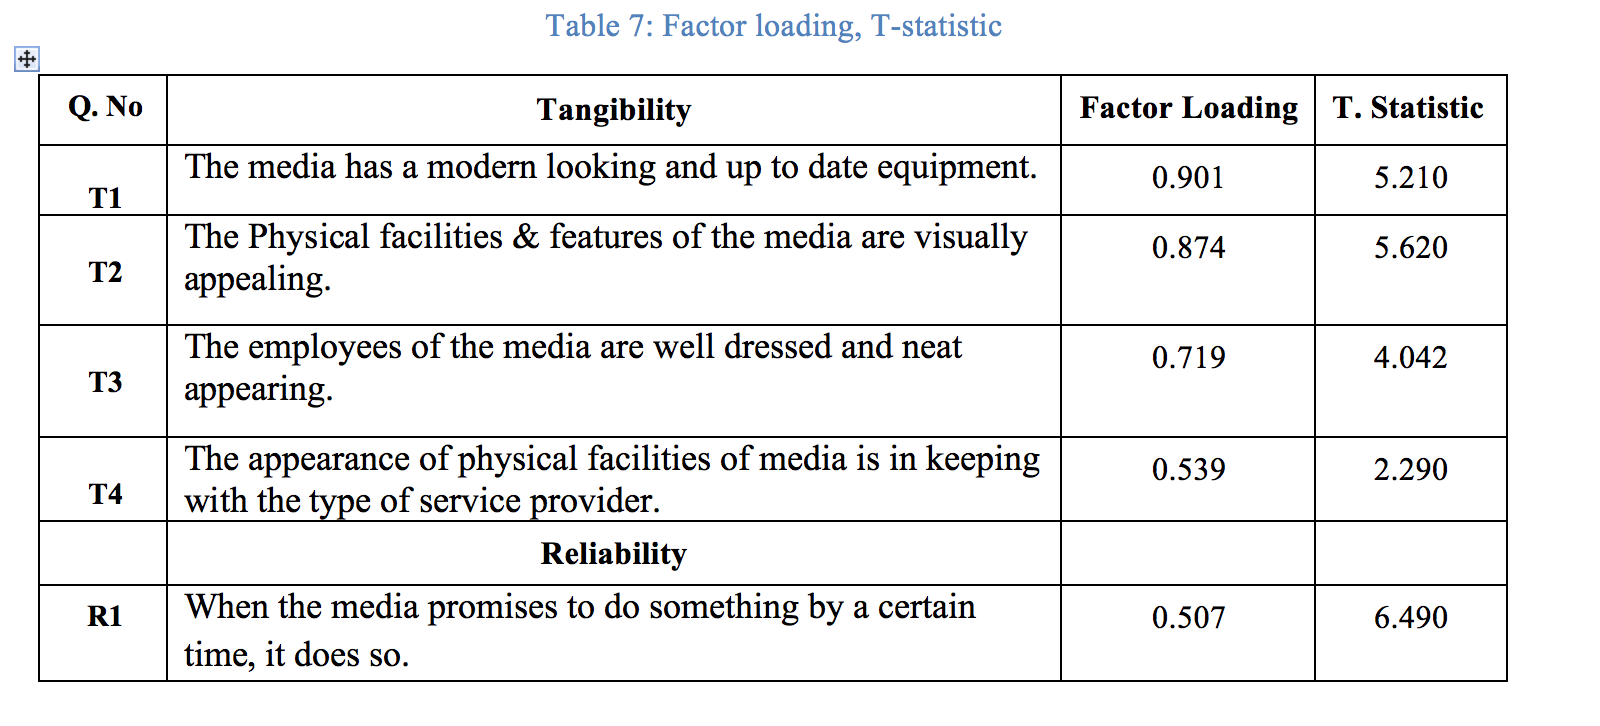
- Screenshot 2016-02-09 19.41.03.png (145.35 KiB) Viewed 13554 times
Re: INTERPERATATION OF T-VALUE
Posted: Tue Feb 09, 2016 6:43 pm
by Farahnaz
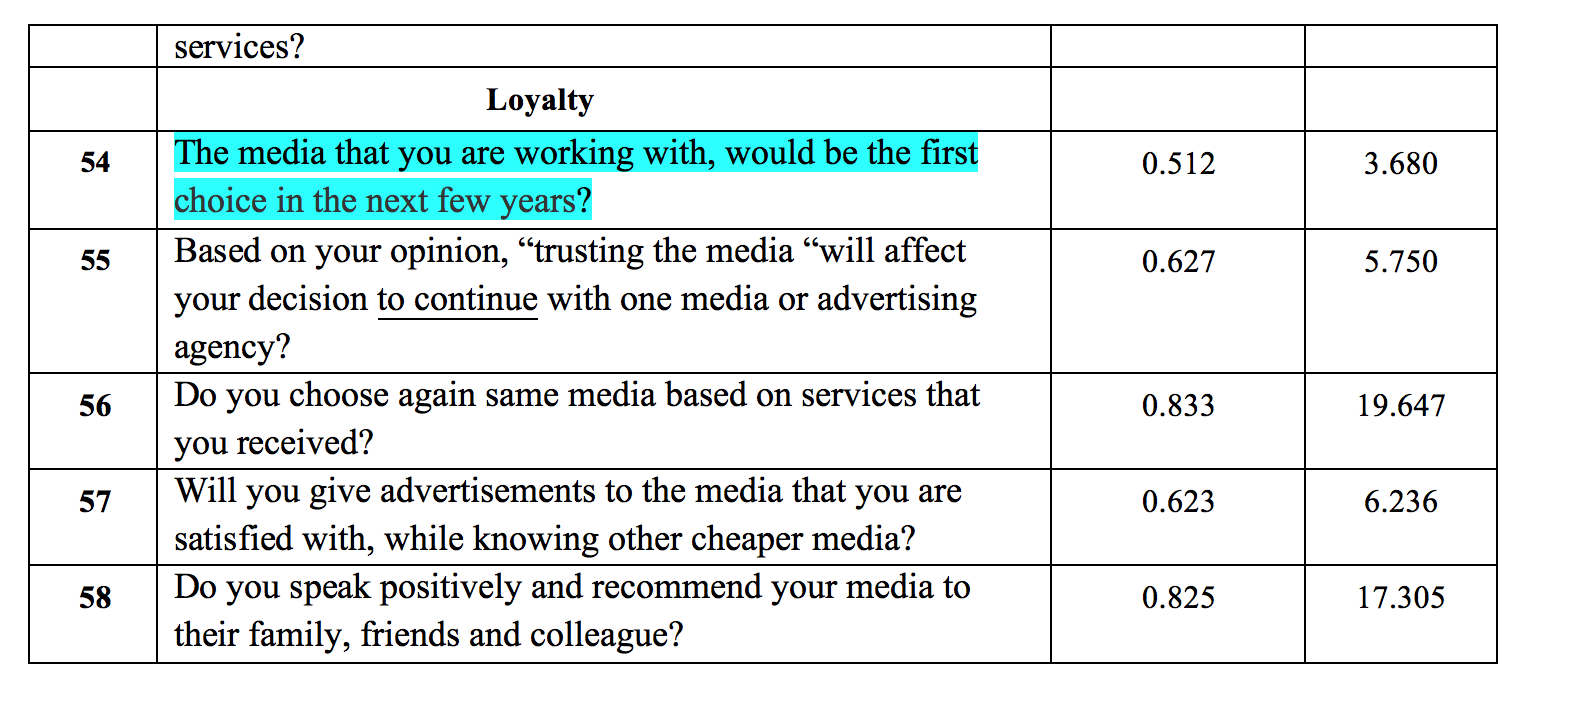
- Screenshot 2016-02-09 19.41.45.png (154.09 KiB) Viewed 13554 times
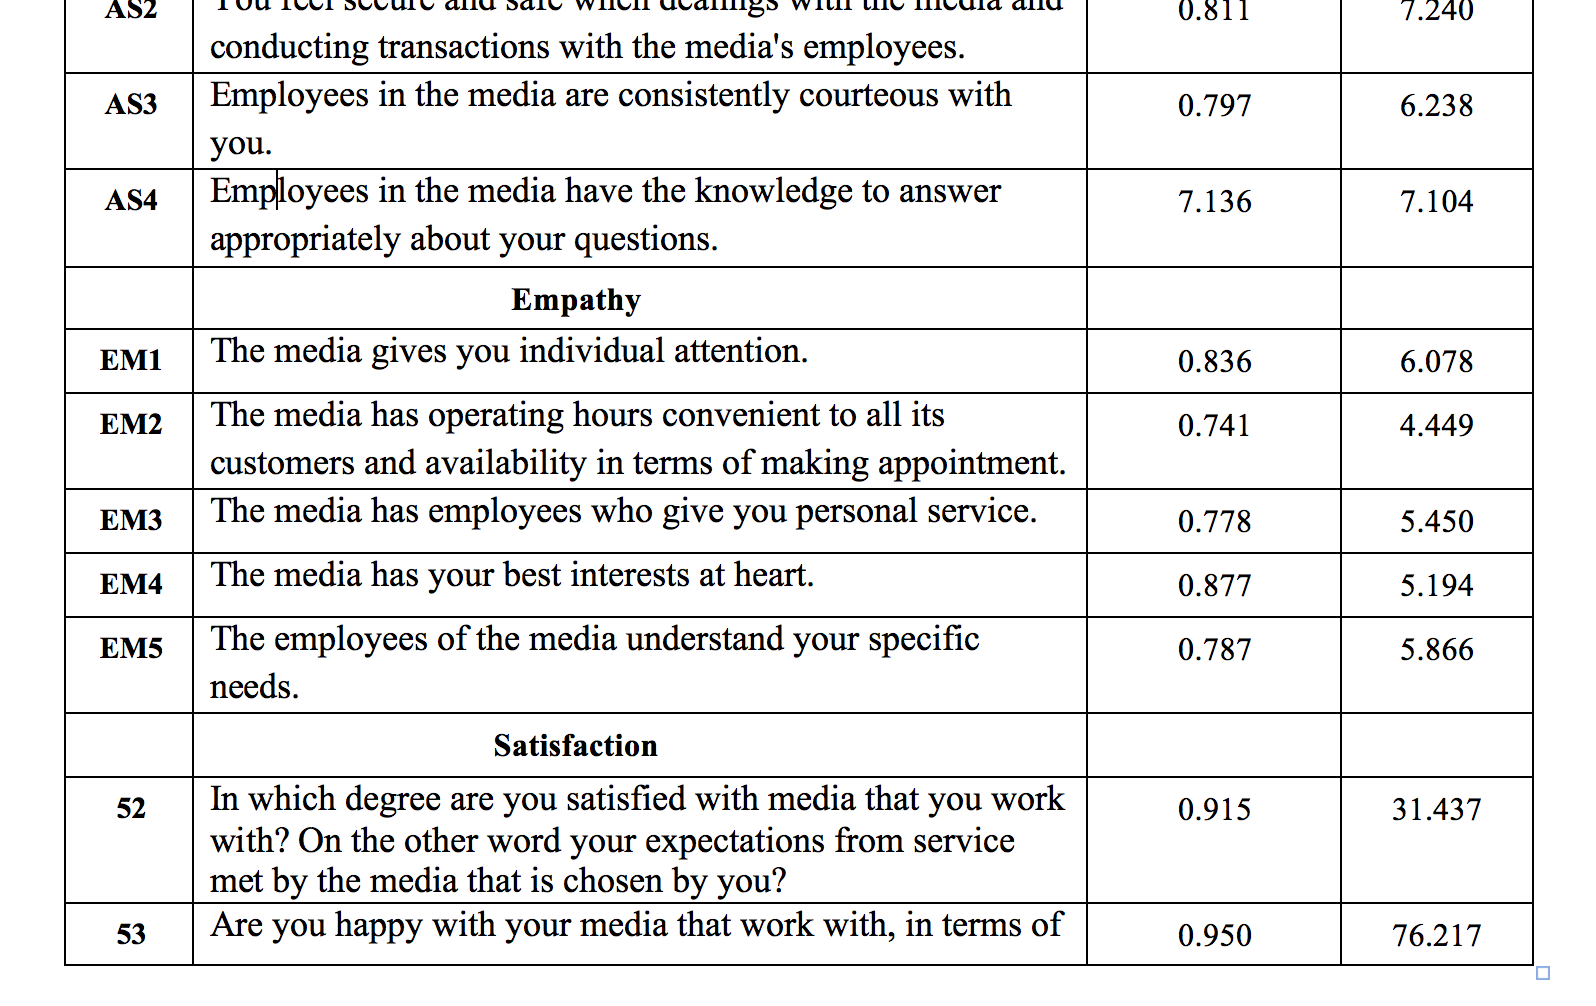
- Screenshot 2016-02-09 19.41.39.png (231.14 KiB) Viewed 13554 times
Re: INTERPERATATION OF T-VALUE
Posted: Tue Feb 09, 2016 7:33 pm
by Farahnaz
I was thinking I have to use regression Analysis but my mentor insist using smart pls as i have 2 dependent variable, I wanted to know if using smartpls correct for this model or not?